Statistics: From First Principles to RegressionStatistics
For Doctors
Text size
Line width
When I select text
Highlight colour
The question asks the AI to
Nothing is sent from this site. The button copies a question, with the passage you chose, to your clipboard: paste it into any AI you use. AI answers can be wrong: check them.
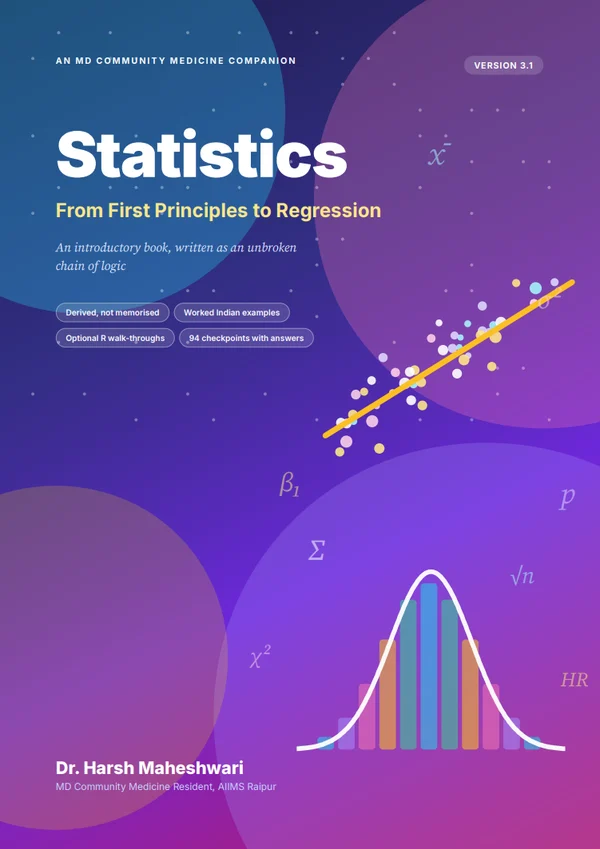
Most statistics books ask you to memorise formulas. This one derives them. Starting from what a clinician already knows, it builds every idea step by step — from describing data, through probability, sampling and estimation, to hypothesis testing, correlation and regression — without a single unexplained leap.
Later chapters extend the same reasoning to generalised linear models, survival analysis, measurement theory (validity and reliability) and threats to study validity. The aim is not to make you a calculator but to let you understand why each method works, and so recognise where it stops working. About 500 pages, with checkpoint questions and answers.
Who is it for?
MBBS students, interns and postgraduate residents (especially Community Medicine / PSM) who need statistics for exams and theses
Clinicians and early researchers who want to read, critique and write papers with real understanding rather than formula recall
Teachers of biostatistics looking for a derivation-first approach
Introduction
iWhy this book exists
iiHow to use this book
iiiIf you are new to statistics
ivR and software are optional
vSymbols and notation
Chapter 1: Statistics – Foundations of Data
1Overview
1.1What Is a Variable
1.2Population vs Sample
1.3Parameter vs Statistic
1.4Organising Raw Data
1.5Study Designs – A First Map
1.6Data in Software – Codebooks, Entry, Cleaning and an R Primer
Chapter 2: Descriptive Statistics – Central Tendency
2Overview
2.1Why We Need a Typical Value
2.2Mean
2.3Median
2.4Mode
2.5Choosing the Right Measure of Central Tendency
Chapter 3: Descriptive Statistics – Dispersion
3Overview
3.1Why Average Alone Is Not Enough
3.2Range
3.3Quartiles Deciles and Percentiles
3.4Interquartile Range
3.5Mean Deviation
3.6Variance
3.7Standard Deviation
3.8Coefficient of Variation
3.9Skewness
3.10Kurtosis
Chapter 4: Data Visualisation
4Overview
4.1Tables for Data Presentation
4.2Diagrams for Qualitative Data
4.3Diagrams for Quantitative Data
4.4Scatter Diagram
4.5Diagrams for Time, Place and Population
Chapter 5: Foundations of Probability
5Overview
5.1From Counting to Probability
5.2Basic Probability Rules
5.3Conditional Probability
5.4Independence of Events
5.5Bayes’ Theorem
5.6Random Variables
5.7Probability Distributions
Chapter 6: Sampling
6Overview
6.1Why We Sample
6.2Probability Sampling Methods
6.3Non-Probability Sampling Methods
6.4Sampling Error vs Bias
6.5Sampling Distribution of a Statistic
6.6Central Limit Theorem
6.7Standard Error
Chapter 7: Estimation
7Overview
7.1Point Estimation
7.2Confidence Intervals
7.3Margin of Error and Sample Size Estimation
7.4Rates, Ratios and Standardisation
7.5The Life Table
Chapter 8: Hypothesis Testing – The Framework
8Overview
8.1Logic of Hypothesis Testing
8.2Null and Alternative Hypothesis
8.3Type I and Type II Error
8.4Significance Level and Power
8.5p-value – Correct Interpretation
8.6One-Tailed vs Two-Tailed Tests
8.7General Steps in Hypothesis Testing
8.8Choosing the Right Statistical Test
Chapter 9: Comparing Groups – Parametric Tests
9Overview
9.1z-test
9.2t-test
9.3Tests of Normality
9.4Data Transformation Techniques
9.5ANOVA
Chapter 10: Comparing Groups – Non-Parametric Tests
10Overview
10.1When to Use Non-Parametric Tests
10.2Mann-Whitney U Test
10.3Wilcoxon Signed-Rank Test
10.4Kruskal-Wallis Test
10.5Friedman Test
10.6Chi-Square Test
10.7Fisher’s Exact Test
10.8McNemar’s Test
Chapter 11: Correlation
11Overview
11.1The Idea of Association
11.2Pearson Correlation Coefficient
11.3Spearman Rank Correlation
11.4Point-Biserial and Phi Coefficient
11.5Correlation vs Causation
11.6Confounding – A Working Introduction
11.7Stratified Analysis – Mantel–Haenszel, Effect Modification and Simpson’s Paradox
Chapter 12: Regression – Foundations
12Overview
12.1From Correlation to Prediction
12.2Simple Linear Regression
12.3Assumptions of Linear Regression
12.4Multiple Linear Regression
12.5Regression Diagnostics
12.6Analysis Journey – Multiple Linear Regression
Chapter 13: Generalised Linear Models
13Overview
13.1Why We Need a Generalised Framework
13.2Logistic Regression
13.3Analysis Journey – Logistic Regression
13.4Counts, Person-Time, Rate, and the Offset
13.5Poisson Regression
13.6Negative Binomial Regression
13.7Estimating Prevalence and Risk Ratios Directly
Chapter 14: Survival Analysis
14Overview
14.1Why Ordinary Regression Fails for Time-to-Event Data
14.2Censoring
14.3Survival Function, Hazard, and the At-Risk Set
14.4Kaplan-Meier Survival Curve
14.5Log-Rank Test
14.6Cox Proportional Hazards Regression
14.7Analysis Journey – Cox Regression
14.8Competing Risks
Chapter 15: Advanced Topics for the Community Medicine Researcher
15Overview
15.1Model Selection
15.2Clustered and Hierarchical Data
15.3Confounding Handling Techniques
15.4Missing Data
15.5Diagnostic Test Statistics
15.6Sample Size and Power Calculation
15.7Meta-Analysis Statistics
15.8Introduction to Bayesian Statistics
15.9Randomised Trials – Randomisation, ITT, Baseline Adjustment, Cluster and Non-Inferiority Designs
Chapter 16: Measurement Theory – Constructs, Validity, and Reliability
16Overview
16.1What Is a Construct
16.2Validity of a Measurement Instrument
16.3Reliability of a Measurement Instrument
16.4Relationship Between Validity and Reliability
16.5Principal Component Analysis
16.6Building Composite Variables
16.7Questionnaire Validation Methodology
Chapter 17: Threats to Study Validity
17Overview
17.1Validity of a Study
17.2Bias in Research
17.3Confounding
17.4Reporting Guidelines and Writing the Statistical Methods
17.5Qualitative and Mixed Methods – What a Quantitative Researcher Must Know
Appendix A: Checkpoint Answers
ACheckpoint Answers
A1Chapter 1: Statistics – Foundations of Data
A2Chapter 2: Descriptive Statistics – Central Tendency
A3Chapter 3: Descriptive Statistics – Dispersion
A4Chapter 4: Data Visualisation
A5Chapter 5: Foundations of Probability
A6Chapter 6: Sampling
A7Chapter 7: Estimation
A8Chapter 8: Hypothesis Testing – The Framework
A9Chapter 9: Comparing Groups – Parametric Tests
A10Chapter 10: Comparing Groups – Non-Parametric Tests
A11Chapter 11: Correlation
A12Chapter 12: Regression – Foundations
A13Chapter 13: Generalised Linear Models
A14Chapter 14: Survival Analysis
A15Chapter 15: Advanced Topics for the Community Medicine Researcher
A16Chapter 16: Measurement Theory – Constructs, Validity, and Reliability